Tag Archives: Economics

Thanksgiving, Appropriately

photo of Frew Wube in Ethiopia

This is a post from my Curious Cat Investing and Economics Blog: Financial Thanksgiving. I have tweaked a bit to tie into appropriate technology since that is the related area to me on this blog.

For me, giving back to others is part of my personal financial plan. As I have said most people that are actually able to read this are financially much better off than billions of other people today. At least they have the potential to be if they don’t chose to live beyond their means. Here are some of the ways I give back to others.

Kiva is a wonderful organization and particularly well suited to discuss because they do a great job of using the internet to make the experience rewarding for people looking to help – as I have mentioned before: Reducing Poverty. One of my goals for this blog is to increase the number of readers participating in Kiva – see current Curious Cat Kivans. I have also created a lending team on Kiva. Kiva added a feature that allows people to connect online. When you make a loan you may link you loan to a group.

I actually give more to Trickle Up, I have been giving to them for a long time. They appeal to my same desire to help people help themselves. I believe in the power of capitalism and people to provide long term increases in standards of living. I love the idea of providing support that grows over time. I like investing and reaping the rewards myself later (with investment I make for myself). But I also like to do that with my gifts. I would like to be able to provide opportunities to many people and have many of them take advantage of that to build a better life for themselves, their families and their children.

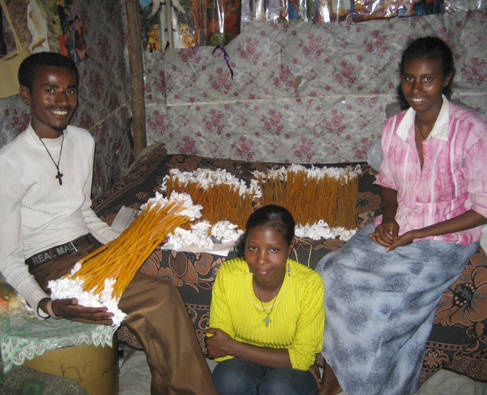
The photo shows Frew Wube, Haimanot and Melkan (brother and two sisters), an entrepreneur that received a grant from Trickle up. Trickle Up provides grants to entrepreneur, similar to micro loans, except the entrepreneur does not have to pay back the grant. They are able to use the full funds to invest in their business and use all the income they are able to generate to increase their standard of living and re-invest in the business.
Continue reading

High-School Social Skills Predict Better Earnings than Test Scores

High-School Social Skills Predict Better Earnings than Test Scores

Ten years after graduation, high-school students who had been rated as conscientious and cooperative by their teachers were earning more than classmates who had similar test scores but fewer social skills, said a new University of Illinois study.

The study’s findings challenge the idea that racial, ethnic, and socioeconomic gaps in educational attainment and earnings can be narrowed solely by emphasizing cognitive skills, said Christy Lleras, a University of Illinois assistant professor of human and community development.

“It’s important to note that good schools do more than teach reading, writing, and math. They socialize students and provide the kinds of learning opportunities that help them to become good citizens and to be successful in the labor market,” she said.

“Unless we address the differences in school climates and curriculum that foster good work habits and other social skills, we’re doing a huge disservice to low-income kids who may be entering the labor market right after high school, especially in our increasingly service-oriented economy,” Lleras added.

The University of Illinois study analyzed data from the National Educational Longitudinal Study, which followed a diverse group of 11,000 tenth graders for 10 years, tracking not only their scores on standard achievement tests but teacher appraisals of such qualities as the students’ work habits, their ability to relate well to peers, and their participation in extracurricular activities, a proxy for the ability to interact well with both students and adults.

The teachers’ assessments were then compared with the students’ self-reported educational attainments and earnings 10 years after high-school graduation. Even after controlling for students’ achievement test scores, family socioeconomic status, and educational attainment, Lleras found that such social skills as conscientiousness, cooperativeness, and motivation were as important as test scores for success in the workplace.

Related: Hands-on High School Engineering Education in Minnesotabuilding on students natural curiouslyFun k-12 Science and Engineering Learning
Continue reading

500 Year Floods

Why you can get ‘500 year floods’ two years in a row by Anne Jefferson:

Flood probabilities are based on historical records of stream discharge. Let’s use the Iowa River at Marengo, Iowa as an example. It reached a record discharge of 46,600 cubic feet per second* (1320 m3/s) on 12 June. That flow was estimated to have a 500 year recurrence interval, based on 51 years of peak flow records

When you are extrapolating beyond your data by an order of magnitude, the highest points in the dataset start to have a lot of leverage. Let’s imagine that there’s another big flood on the Iowa River next year and we do the same analysis. Now our dataset has 52 points, with the highest being the flood of 2008. When that point is included in the analysis, a discharge of 46,600 cubic feet per second* (1320 m3/s) has a recurrence interval of <150 years (>0.6%). It’s still a darn big flow, but it doesn’t sound quite so biblical anymore.

Urbanization and the adding of impervious surface is one cause of increasing flood peaks, but in Iowa, a more likely culprit is agricultural.

This post is a good explanation that the 500 year flood idea is just way of saying .2% probability (that some people confuse as meaning it can only happen every 500 years). But I actually am more interested in the other factor which is how much estimation is in “500 year prediction.” We don’t have 500 years of data. And the conditions today (I believe) are much more likely to create extreme conditions. So taking comfort in 500 year (.2%), or even 100 year (1% probability) flood “predictions” is dangerous.

It would seem to me, in fact, actually having a 500 year flood actually increases the odds for it happening again (because the data now includes that case which had not been included before). It doesn’t actually increase the likelihood of it happening but the predictions we make are based on the data we have (so given that it happens our previous 500 year prediction is questionable). With a coin toss we know the odds are 50%, getting 3 heads in a row doesn’t convince us that our prediction was bad. And therefore the previous record of heads or tails in the coin toss have no predictive value.

I can’t see why we would think that for floods. With the new data showing a flood, (it seems to me) most any model is likely to show an increased risk (and pretty substantial I would think) of it happening again in the next 100 years (especially in any area with substantial human construction – where conditions could well be very different than it was for our data that is 20, 40… years old). And if we are entering a period of more extreme weather then that will likely be a factor too…

The comments on the original blog post make some interesting points too – don’t miss those.

Related: Two 500-Year Floods Within 15 Years: What are the Odds? USGS – All Models Are Wrong But Some Are Useful by George BoxCancer Deaths – Declining Trend?Megaflood Created the English ChannelSeeing Patterns Where None ExistsDangers of Forgetting the Proxy Nature of DataUnderstanding Data